

ATNMActionable
Actinium Pharmaceuticals
Healthcare
Fundamental4
Sentiment3
Technical5
- FundamentalStrengthened balance sheet
- SentimentConstructive on partnership talk
- TechnicalMomentum confirms accumulation
QuarterHawk continuously analyses fundamentals, sentiment and technicals — combining the evidence into an FST score, a clear verdict and, when the signals align, a trade plan.
Coverage snapshot
Companies under coverage
Actionable research results
Re-analysed · last 7 days
Each stock is scored 0–5 on three independent axes. Only when they agree does a position earn the Actionable mark — the same scoring you see inside the app.
The 0–5 scale, identical to the app
Balance-sheet strength, cash runway, revenue trajectory and dilution risk — the numbers a fund analyst rebuilds from the filings, kept current every run.
Example score
News flow, filings tone and social signal, weighed for direction and conviction — separating a genuine shift in narrative from noise.
Example score
Trend, momentum, volume and structure — whether price action confirms the thesis or argues against it right now.
Example score
Every QuarterHawk analysis starts from evidence, not opinion. For the U.S.-listed stocks under $25 that QuarterHawk covers, our AI-assisted pipeline gathers company financials and historical metrics, SEC filings and disclosures, company and market news, public sentiment signals, third-party analyst ratings, and end-of-day price and volume. That evidence feeds three pillars — Fundamental, Sentiment, and Technical — each scored 0 to 5, where 0 simply means “not yet analysed.” The pillars combine into a plain verdict, Actionable or No Action; a step-by-step trade plan (entry, stop, targets, reward-to-risk) is shown only when all three align — so a No Action result may carry no plan at all. When material new information appears, a stock can be re-analysed, and every version is kept and dated.
Automation assists this research; results can be incomplete or wrong, and nothing here is investment advice.
Read the full methodology →Every company in coverage gets the same treatment: three scored axes, a plain-language read on each, and a single verdict you can act on — or not. When the evidence doesn’t line up, that verdict is No Action — not a forced trade idea.
Under the hood, an analysis spans valuation, profitability, growth and risk; sentiment from news and disclosures; the technicals of price and momentum; and — where available — SEC disclosures, earnings, company news and a dated FST score history. When the signals align it adds an entry, protective stop, targets and reward:risk; a downloadable report brings it all together.
Representative example — a real, recently-published card appears here once the research feed is available.
Actinium Pharmaceuticals
Everything above shows how the analysis works. Here it is inside the app — a real, recently-published read on UGP (Ultrapar): the scores and verdict, the trade plan drawn on the chart the day it was published, and the same chart a few sessions later.
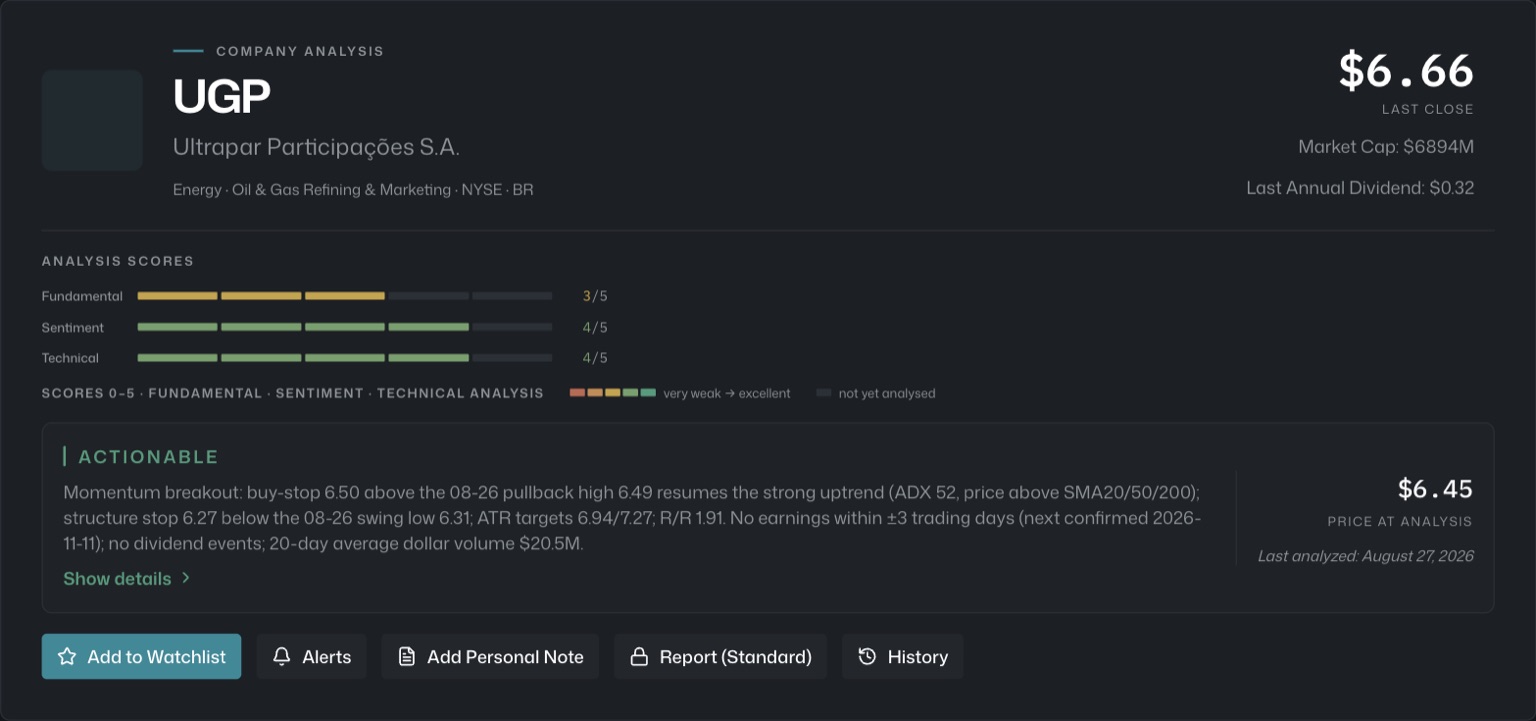
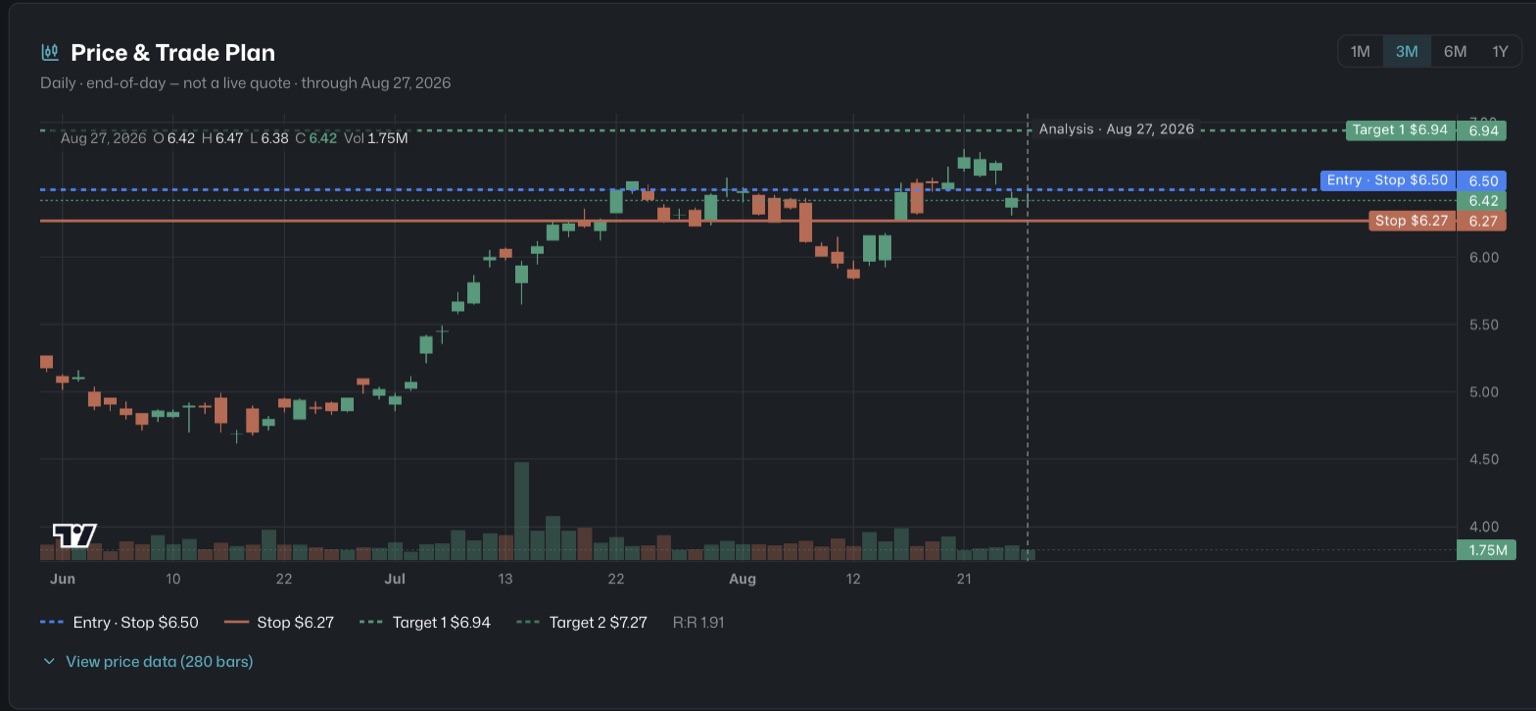
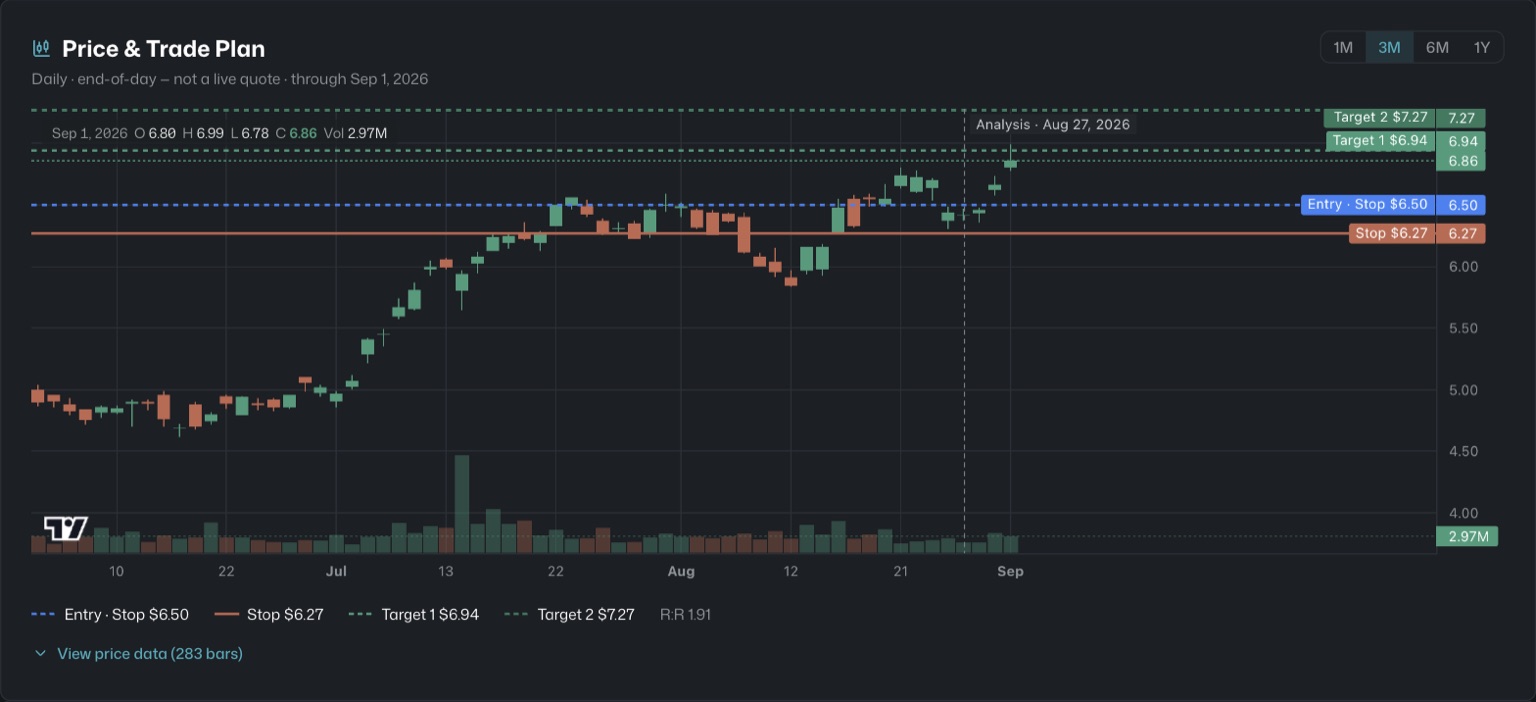
A single published analysis, shown for illustration — not a recommendation and not a performance claim. Charts are end-of-day, not live quotes. See the forward paper-trading record →
A single 0–5 score is the headline. Underneath, each company is broken down metric by metric and plotted against the range a strong business should sit in — so you see not just the grade, but where it comes from.
Every re-analysis is kept. Follow how a company's scores move over time, then open any two dates side by side to see exactly what changed — the scores, the verdict, the trade plan, the fundamentals, technicals and catalysts — in neutral, no-spin terms.
The piece that was missing in June — confirmed price momentum — is now in place, and the verdict flipped to Actionable because all three signals finally agree.
Representative example — every company carries its full analysis history.
An Actionable verdict comes with a concrete plan — a limit to buy at, a stop to protect the downside, and two targets — laid straight over the price, with the day it was set marked so you always know the context.
Names where fundamental, sentiment and technical all agree — from our latest published research. Open any one for the full read.
No names currently clear all three signals — and that’s a valid answer too.
The desk flags a name only when all three signals agree. Restraint is part of the method.
We publish the full Fundamental·Sentiment·Technical read on every stock we cover — free, on a two-trading-day delay. Browse it now; subscribe when you want the current read instead of the two-day-delayed one.
Every stock QuarterHawk flags Actionable is paper-bought and tracked forward on real prices — a forward paper-trading simulation from a fixed $10,000 on June 25, 2026, measured against the S&P 500, Dow, and NASDAQ. It's recomputed every night, and we publish every result — winning and losing days alike.
Hypothetical / simulated — no real money, not a backtest, and not investment advice. Simulated results do not predict future performance.
See the full performance →Two live feeds watch every tracked company through the trading day. When something material happens, the full score is rebuilt automatically and you’re notified — no waiting for the next scheduled research run.
We watch the major newswires and the full press-release firehose. When a release lands on a company you follow — earnings, M&A, a dividend, fresh guidance — it is matched to the ticker and queued for a fresh analysis. Bullish or bearish, the re-score is automatic.
During trading hours we track the gainers, losers and most-actives. When a liquid, qualified name breaks onto the leaderboard, it is pulled in for a fresh analysis — so a sudden move gets a prompt read on whether the signal actually holds.
Event to answer, one automatic path
Signal fires
News breaks, or a name jumps the board
Caught live
Newswire + market feeds, polled continuously
Re-scored
Full Fundamental · Sentiment · Technical, automatically
You're alerted
Notification the moment the verdict lands
QuarterHawk re-analyses a company when something material lands — not on a fixed overnight cycle — so a fresh verdict is ready while a batch tool is still waiting for its next scheduled run.
Every company is re-scored as new filings, price action and news land — not a one-off snapshot.
Every past run is kept — follow how the scores moved and read exactly what changed between any two dates.
Track the names you care about — emailed when a fresh analysis lands or a verdict turns Actionable. Cadence follows your plan.
Set your own triggers — FST scores, verdicts, price or indicator levels, reward:risk — emailed when a new analysis or the end-of-day check finds a match.
Ranked lists — Picks, Undervalued, Quality and Improving — surface where the signal is strongest.
Line up to eight companies in one matrix — scores, valuation, profitability and technicals, best-in-row highlighted.
A written market read each day — phase, movers, sectors, yields and the earnings on deck — before you dig in.
Export a full PDF write-up per company — the fundamentals, the scoring, the rationale, ready to file.
Every plan runs the full analysis on every company — tiers change how much you track and how fast you're alerted, not the depth of the research.
Research anything.
Free forever
Follow what matters to you.
billed monthly
Everything in Free, plus:
Never miss the setup.
billed monthly
Everything in Standard, plus:
Every new account starts with a 15-day Standard trial — no card required. When it ends, keep going on Free or pick a plan.
Pulled straight from the help centre — the same answers you’ll find inside the app.
Read the full help centre in the app — the answers to every question, in one place →
We use analytics cookies to understand how the site is used. They stay off until you accept. Cookie policy